Let’s cover two sections today:
1.09 Other signals
1.10 Logic Levels
We have been looking at Voltage as a function of time and seeing how it will look on a graph. The past few days we have talked about graphs that are sine wave.
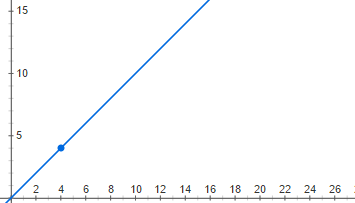
But there could be other ways that this could look too. Consider if voltage started out at zero and continued to increase. It would look something like this:
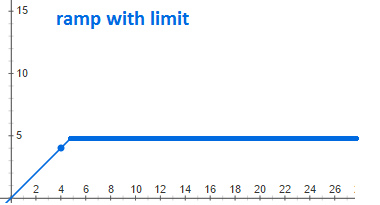
But it is not possible to increase voltage indefinitely and so the graph would really look like this: (Ramp with limit)
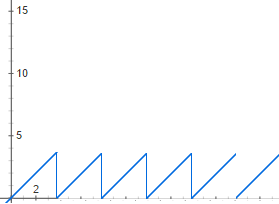
But there are other interesting graphs to. Consider the case of voltage increasing to a point, and then when it reaches a certain point it goes to zero and then begins again. Let’s say you have a circuit that triggers at a certain voltage, and a capacitor that you are charging up till that point. It might looks something like this sawtooth wave:
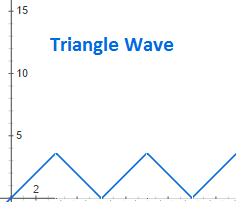
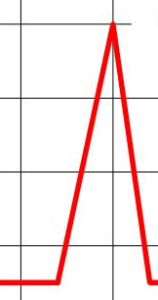
But you can also imagine a case where it reaches a point and decreases at the same linear rate. This would look like a triangle wave:
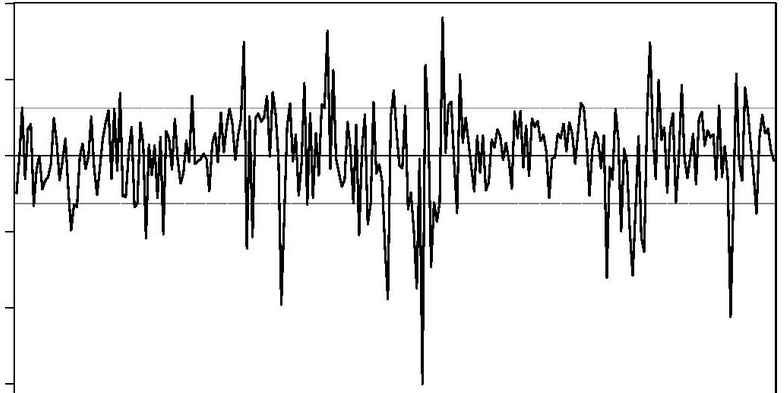
And then there is noise, a complex, background static that we always need to consider and usually minimize:
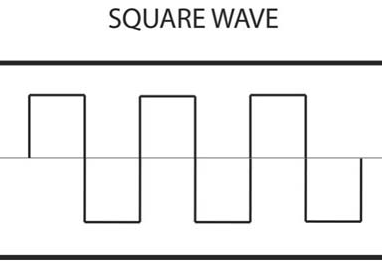
Square waves
Steps
Spikes
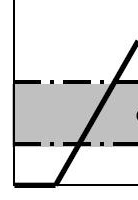
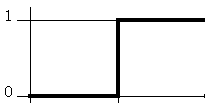
But in digital electronics we concern ourselves with logic levels and interrupting a particular voltage as either a true or a false; as a on or a off; as a 1 or 0. Most digital electronics have a threshold voltage. Above that voltage it is considered to be true/on/1. Below that voltage it is considered to be false/off/0.